Keen to know more
about our Full Service?
Our world class qualitative user testing can help explain the why behind your data and give you the answers to your burning questions.


 10 Aug 2020
 4 minutes read
What is a confidence interval? How do confidence intervals work? If you’re interested in learning all about confidence intervals and what they mean for your user research, read on! When running usability tests, KPIs and other quantitative metrics can be powerful tools in evaluating UX. Success metrics like task completion rate, efficiency metrics like time-on-task, and standardised questionnaires like the System Usability Scale (SUS) can help you quickly assess and compare the usability of your designs. However, before you make any important business decisions, you need to determine if your sample data is representative of your actual customer base. Finding the population mean, which is the average of every person who fits your demographic, would be unrealistic and costly. Therefore, any user test, especially those done on a small-scale, is subject to some amount of sampling error. This error can lead to both overconfidence or unfounded skepticism with your data. In order to counteract this, user researchers use confidence intervals to determine what the population mean could look like based on the sample data.
What are confidence intervals?
A confidence interval tells us how accurate our data is. Wondering how to calculate confidence a interval? Knowing how to calculate a confidence interval can be challenging. It is calculated by deriving the upper and lower limits of the sample data, which give us a range of values where the population mean would likely lie. Say we ask 10 people to rate how easy it is to complete a task on a scale of 1 to 7 and the average is 5. You can generate confidence intervals that show the likely population mean would be between 4.2 and 5.8. The more people we ask, the smaller the range becomes.
Exactly how likely your population mean is within the confidence intervals is determined by the level of confidence you choose. UX researchers typically calculate confidence intervals with 95% confidence. This means that there is a 95% chance that the population mean will lie within the confidence intervals you derived. It is important to choose what level of confidence you are willing to accept to make conclusions with your data. Higher levels of confidence will give you wider intervals with the same sample size. You need to test at a large enough scale to have confidence intervals that are narrow enough for you to properly assess your data. Confidence intervals are an important part of UX research and should be recognised as so.
Why do confidence intervals matter in user research?
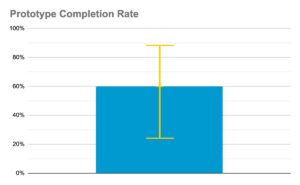
You may be wondering how to interpret confidence intervals. Say you are conducting a usability test on a prototype to see the completion rate of your new feature. Your goal is to have a 90% completion rate at launch. After testing with 5 participants, you observe that only 3 out of 5 completed the test task. If you were to calculate the confidence intervals at 95% confidence, you would find that the lower limit could be as low at 23% while the upper limit could be as high as 88% completion. While the sample size is small, you can still present these findings to stakeholders and definitively show that this new feature needs improvement. Because our upper limit was below 90% completion rate, there is only a 5% chance that the product would achieve 90% completion if launched.
Utilizing confidence intervals in user research can help you to make informed decisions even when using small sample sizes and adds to the benefits of user research. Take the guesswork out of testing and instead discuss probabilities. If your confidence intervals are too wide to make statistical conclusions, increase the sample size and see if your results change.
Making Comparisons with Confidence Intervals
One way you can utilise usability testing is to compare the effectiveness of two different design iterations. Say your team wants to know which iteration will have a higher completion rate at launch. In order to make statistically significant comparisons, you need to take into account the confidence intervals for both iterations. For example, here is completion rate data for designs A and B collected with 10 and 100 test participants respectively:
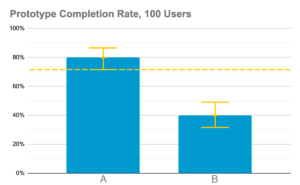
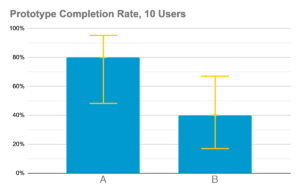
In this example, using only 10 testers per test resulted in an overlap in your confidence intervals. In theory, these two designs could have the same completion rates when launched to your entire customer base despite design A performing better in the test. Increasing the sample size to 100 testers definitively shows that design A’s completion rates will be higher than design B’s at least 95% of the time. Having a larger sample size narrows our confidence intervals enough to show that the completion rates of these two iterations will be different from each other.
Dealing with wide confidence intervals
Does this mean that you can’t make effective comparisons with smaller sample sizes? That depends on how much potential error you are willing to accept. If designs A and B from the previous example were both early prototypes, then it makes more sense to continue developing design A. The upper limit of design B’s completion rate is only 68% whereas design A’s could be as high as 95%. Given that these are early prototypes, it would not be a big risk to pick design A over B to continue to develop. If you were making a decision between two iterations that are ready to launch, then you would need to conduct further user tests to be sure that you are presenting your users with the superior product.
Sometimes, using different usability metrics with smaller sample sizes can be more effective. Completion rate is a binomial metric, meaning that either the tester will complete the task or won’t, and this results in wider confidence intervals. Instead, you could measure task ease (SEQ), which is recorded on a 1-7 scale and is more nuanced than a simple yes or no. Even at small sample sizes, the confidence intervals will be narrower than what we saw with completion rates while still measuring the effectiveness of our design. Choose the metric and sample size that will give you narrow enough confidence intervals that you feel comfortable making decisions with.
Takeaways
Confidence intervals are another layer of user research that allows you to apply your small-scale user tests to your actual user base. The key to assessing data using confidence intervals is to ask yourself how wide of a range you are willing to accept for your data. In early user research prototypes, it makes sense to conduct small scale user tests to quickly figure out what isn’t working. When trying to reach usability goals at launch or making comparisons between designs, larger sample sizes are required to make statistically relevant conclusions. Design a test plan that makes the most sense for your current goals, and leverage confidence intervals to add credibility to your conclusions.

Our world class qualitative user testing can help explain the why behind your data and give you the answers to your burning questions.